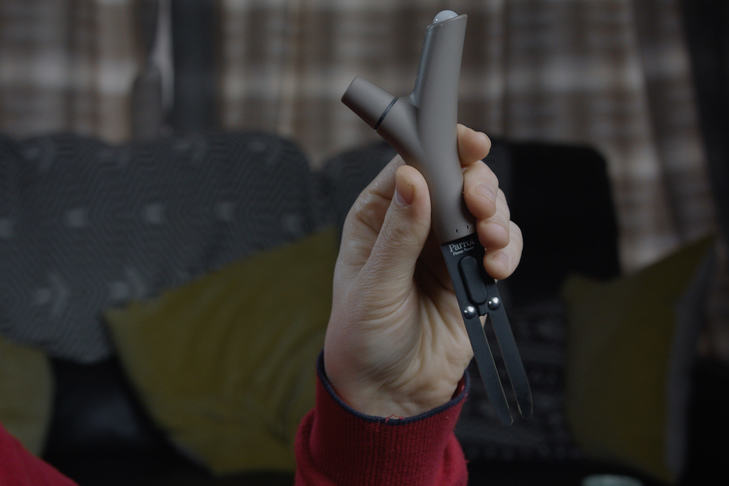
Image: GROW
Now it’s your turn! We’ve prepared some data for you to play with. The data sheets contain data that have been collected by citizen scientists based in Austria, Hungary and Greece as part of the GROW Observatory project. To explore the data, follow these easy steps:
Download the two sets of data from the GROW Knowledge Hub. You should be able to open them with different types of spreadsheet software.
Familiarise yourself with the data by taking a closer look. What differences between sets can you identify purely based on how the data are named and presented? Investigate sets 1 and 2. There are many ways to play around with them. Below we give a few ideas for activities. You can do one or more of them, but don’t feel you need to do them all unless you want to explore them all.
Activity 1: Try to find the main differences between sets 1 and 2.
Activity 2: Compare data from set 2, regarding the three different land cover types: wheat, grass and forest. What insights can you gain from the comparison?
Activity 3: Compare the different data from Austria, Hungary and Greece from set 1. What insights can you gain from this comparison?
Activity 4: What kind of events and other circumstances can you think of that may influence the changes in soil moisture?
Activity 5: We have also added location data for the sensors that generated the data. For mapping sensor locations in your own project, you can use, for example, Zeemaps.