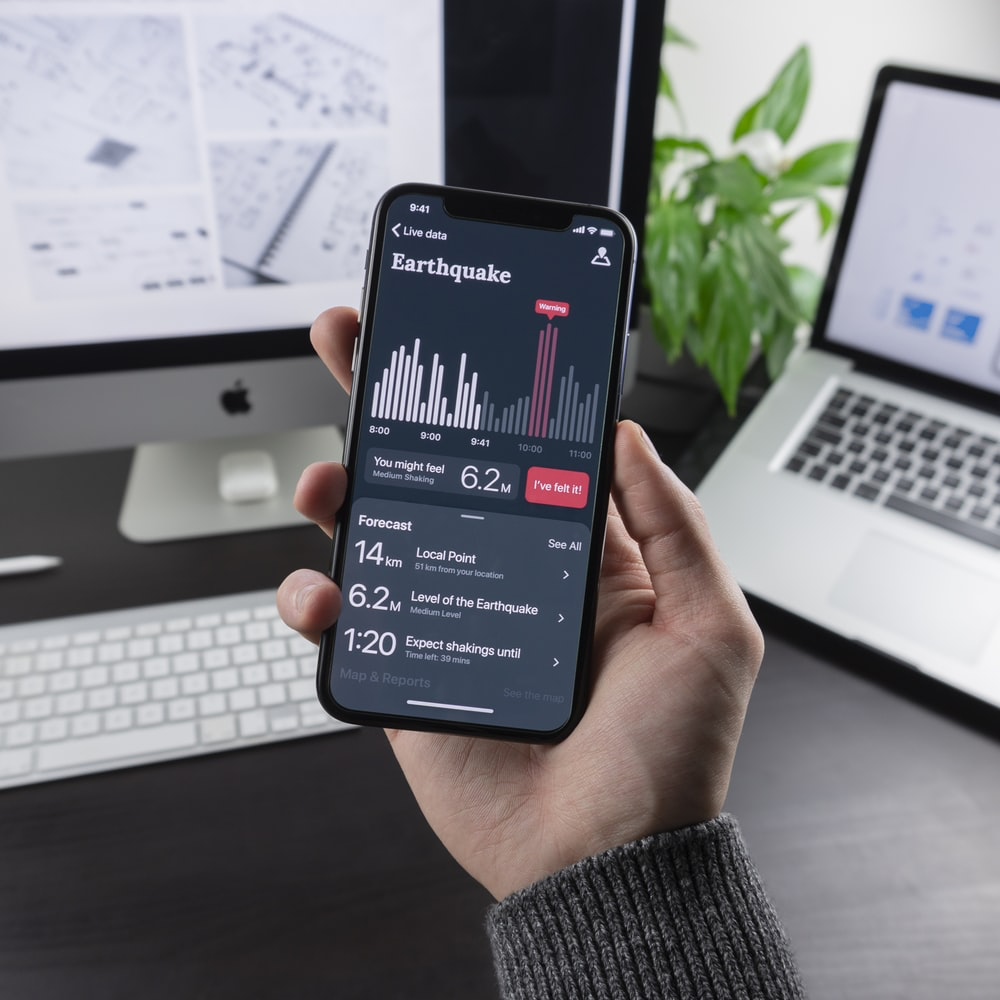
 When you are developing a citizen science project, it is crucial to think about what kind of data you want the citizens to collect, from the very beginning. The type of data you collect will influence the shape, format and ways of running of the citizen observatory. It will also determine which citizens are dedicated to your observatory and the technologies they will use. This will be important for the citizens you are trying to engage.
Projects that collect observations are the most common in citizen science. For example, citizens might report observations of phenomena in their own environment. These observations can be collected with or without equipment. For example, you might record each time you see a particular species of bird in your garden, as in the phenological observatory developed within the Ground Truth 2.0 project RitmeNatura or you might use sensors to measure air quality or capture meteorological information, just as the citizens in the GroundTruth 2.0 MeetMeMechelen observatory project did, using sensors installed in their bicycles.
Citizens can provide other kinds of data, too. For example, they can validate or interpret scientific data, or contribute to pattern recognition and image analysis, as in the Adrift project, which helps scientists map the ocean trajectories of marine microbes within a simulated web environment.
Most citizen science initiatives are based on people monitoring and registering observations, sometimes using equipment. For this kind of data, the user’s identification, the time and place of the observation, the value of the observation and some supporting material like images, audio recordings or videos for validation purposes is usually collected. Observations can be as simple as registering a temperature or as complex as taking a lot of measurements as in the RiuNet project, where citizens conduct a complete scientific analysis of several organic and inorganic parameters indicating river water quality.
Observations that use sensor measurements require some additional information, depending on the type of sensor used. You might record the sensor model, date of calibration, sensor parameters, and so on.
These types of observational data include biodiversity observations, environmental monitoring, meteorological observations, hydrological measurements, land cover mapping, and more.
There are other types of projects that are based on the validation of satellite observations with what humans can observe on the ground, the human ability to recognise patterns that computers can’t, and the meta-tagging of objects within photos (such as identifying wildlife captured by motion-triggered camera traps. These are all examples of projects that do not collect data directly but instead interpret, analyse or summarise data. Zooniverse is probably the most well-known platform to host these types of projects that citizens can participate in from their homes, no matter their location, just by using a computer. In this way, they can still contribute to the existing data by adding explanations or corrections, descriptions, identifications, and even complete complex data surveys.
A variety of scientific activities can be done in this crowdsourced way, but the data collected in each case will vary widely. The data itself is more important than contextual information like location, time and place, user, or device. The information you want the citizens to provide should be carefully defined and the surveys carefully designed in consideration of the scientific goal.
To define the type of data you will need, think about time and location coverage of the issue, and the nature of the question you are trying to answer. Questions like ‘where do we need the data to be collected?’ (limited or in a vast zone, predetermined or random, in the field or by a computer) and ‘do we need to repeat observations for the same sample?’, will influence the type of data you collect. These questions will determine what information you require, and also the kinds of technology that you might want to use to capture that information.
Things to keep in mind
Challenges in data collection
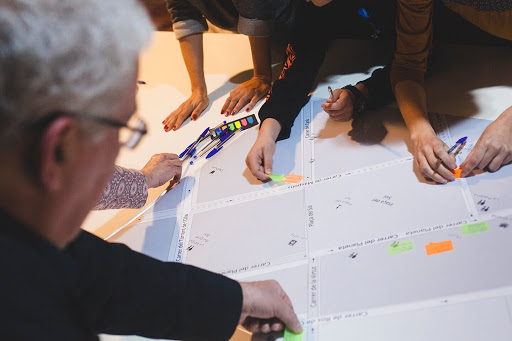 Like Murphy’s Law says: what can go wrong, will go wrong!
But if you have a good plan and a motivated community, challenges in collecting data are easy to overcome. Let’s go over some of the common pitfalls and share tips that can help.
People who join citizen science campaigns for the first time might not be familiar with ways to collect data. To some, this might seem like a daunting task. To help your participants along, provide helpful resources such as onboarding kits or sensing manuals. The Citizen Sensing: A Toolkit provides an introduction to many tools and is a helpful guide for anyone looking to start a citizen science project. WeObserve also has a Toolkit on its website with tools from all the Citizen Observatories.
The GROW Observatory also created an online course on FutureLearn to help growers measure soil moisture and quality. These are just a few examples of step-by-step guides that help citizen scientists use technology and follow data collection processes.
Calibration and technology maintenance during a campaign can be challenging. Many different devices help participants collect data, and these don’t always work the first time. You have to keep an eye on them to make sure they are working correctly. Knowing your sensor before you begin is key. Host a community meeting (online or face-to-face) to introduce the technology, explain how to use it and show everyone how to connect it to the data collection platform. This meeting gives everyone a chance to share their concerns before data collection begins. If possible, invite a technology expert so that they can show everyone how to use the sensor, mobile application or platform. They can also help to answer any questions or discuss common pitfalls and how to overcome them.
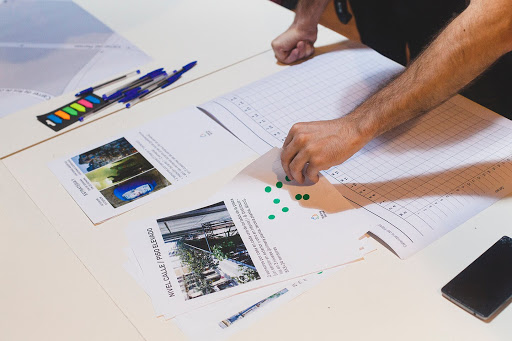 Having target measurements and a sensing strategy can also help a community to discuss what should be measured, when, where, how and by whom. Having a map of the geographic area where you would like to collect data allows everyone to pinpoint the location where they can capture data. Another useful tool is a calendar, where everyone can decide on the best dates and times for recording measurements.
Knowing what types of data to collect is just as important as having a good plan for collecting them. It’s not always about capturing data solely on your environmental concern. Other types of complementary data can give insight into the issue or help participants see where positive changes can be made. In the next step, we will share some details on how to use community-level indicators, which can help you to unpack the environmental concern you are working on.
In this video, we heard from Professor Mel Woods at the University of Dundee, who explained community-level indicators and other measurements that can help you to understand sensor data.
Community-level Indicators help to make the invisible, visible. They give complementary information to the data collected. They focus on shedding light on cause and effect surrounding the environmental issue. These indicators are chosen by the community and reflect the aims of the campaign.
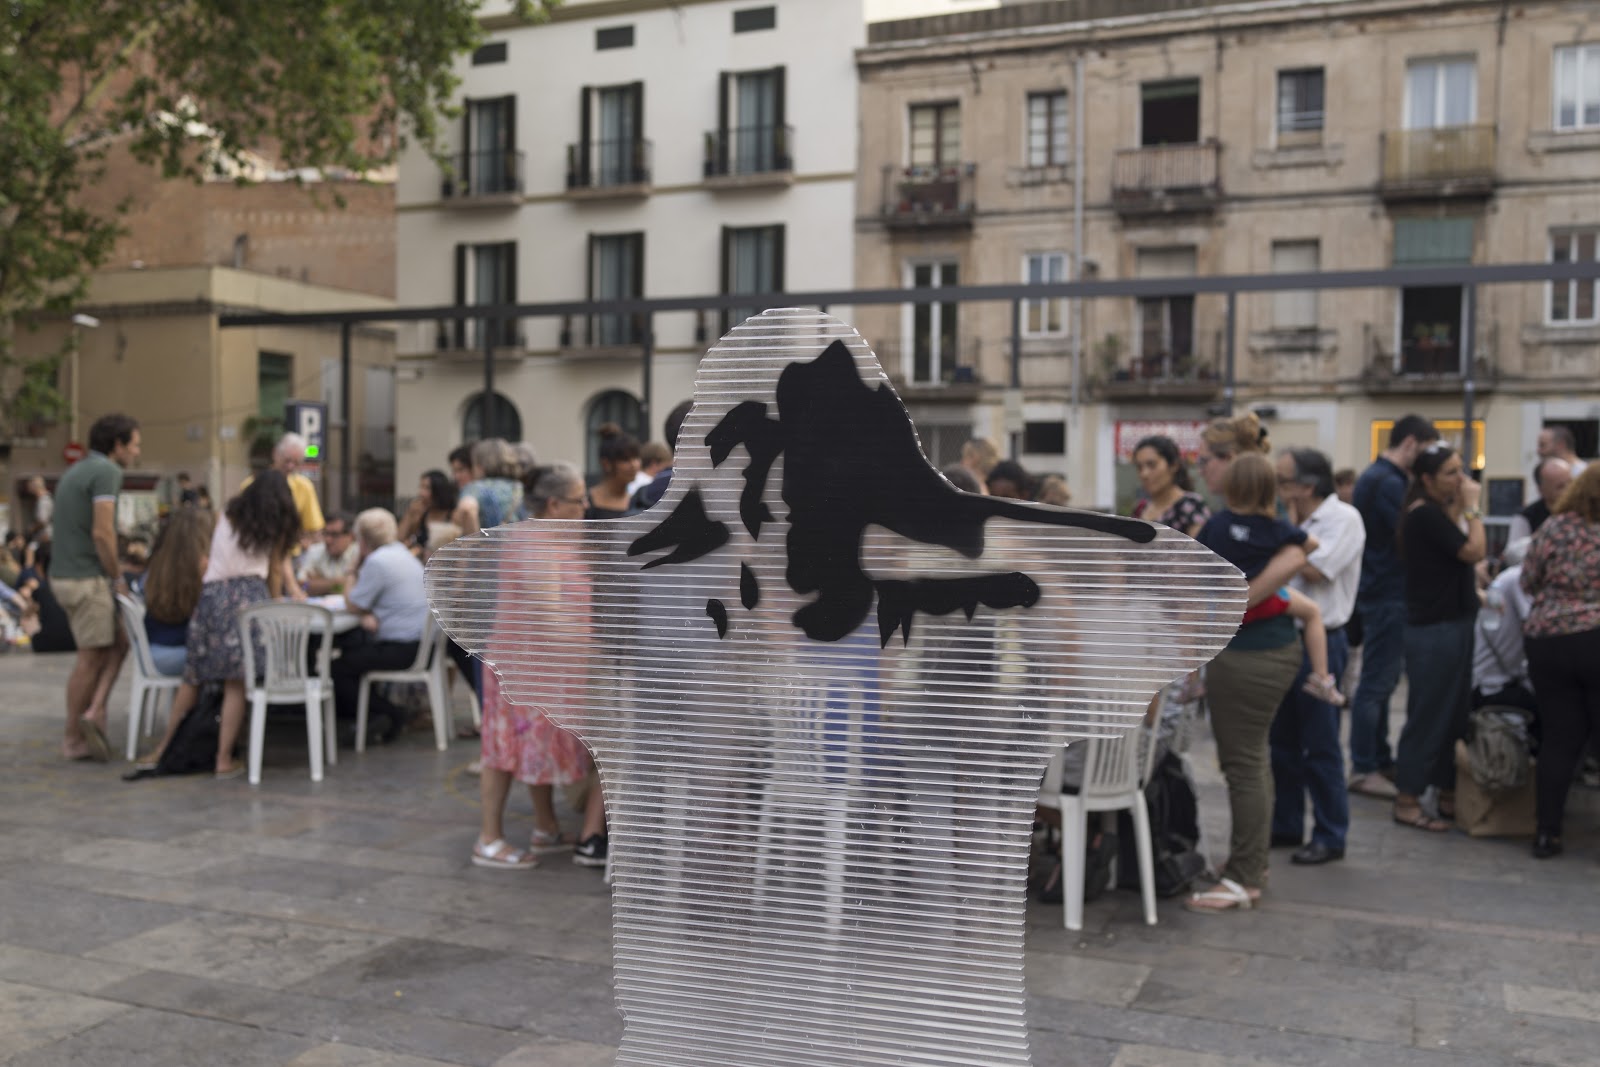 In the video, you can find out about an interesting citizen science campaign that was part of the Making Sense project in Barcelona. The campaign brought residents of a plaza in the Gràcia neighbourhood together to work on a shared concern: noise pollution. Living around one of the busiest squares in the city, they were often kept up until late at night with people loitering and drinking in the square.
As part of the Making Sense project, they used the Smart Citizen Kit and Platform to record the level of noise in their homes through the day. They also discussed and selected other indicators they could gather that would help them understand the issue and build a more significant case for change. This included monitoring the number of people who were in the square at different times and how they moved throughout the public space. They also kept a record of opening times of local cafes and shops that sold alcohol.
Residents used this information to build a more durable case to explain the causes of noise pollution that they were afflicted by. Their insights were used to develop solutions. The council decided to change the time when the square was cleaned and washed down to later in the evening and this would move people on and away from the square. The residents also campaigned for making the square more family-friendly with outdoor play areas and they led quiet activities, like meditation and group yoga.
 Community Level Indicators (CLIs) make the invisible visible. They are extra information a community of citizen science collects to complement sensor data. These measurements reflect the community’s goals of the project and their needs. For example, if a community was concerned about air pollution in their area they might start a campaign to reduce the number of cars that drive on their street while using a sensor to monitor changes in air quality. The CLI, in this case, would be the measurement of car traffic and could be monitored over time to see if the actions of the campaign had successfully helped to reduce the number which drove on the specific street and if this decrease resulted in improved air quality.
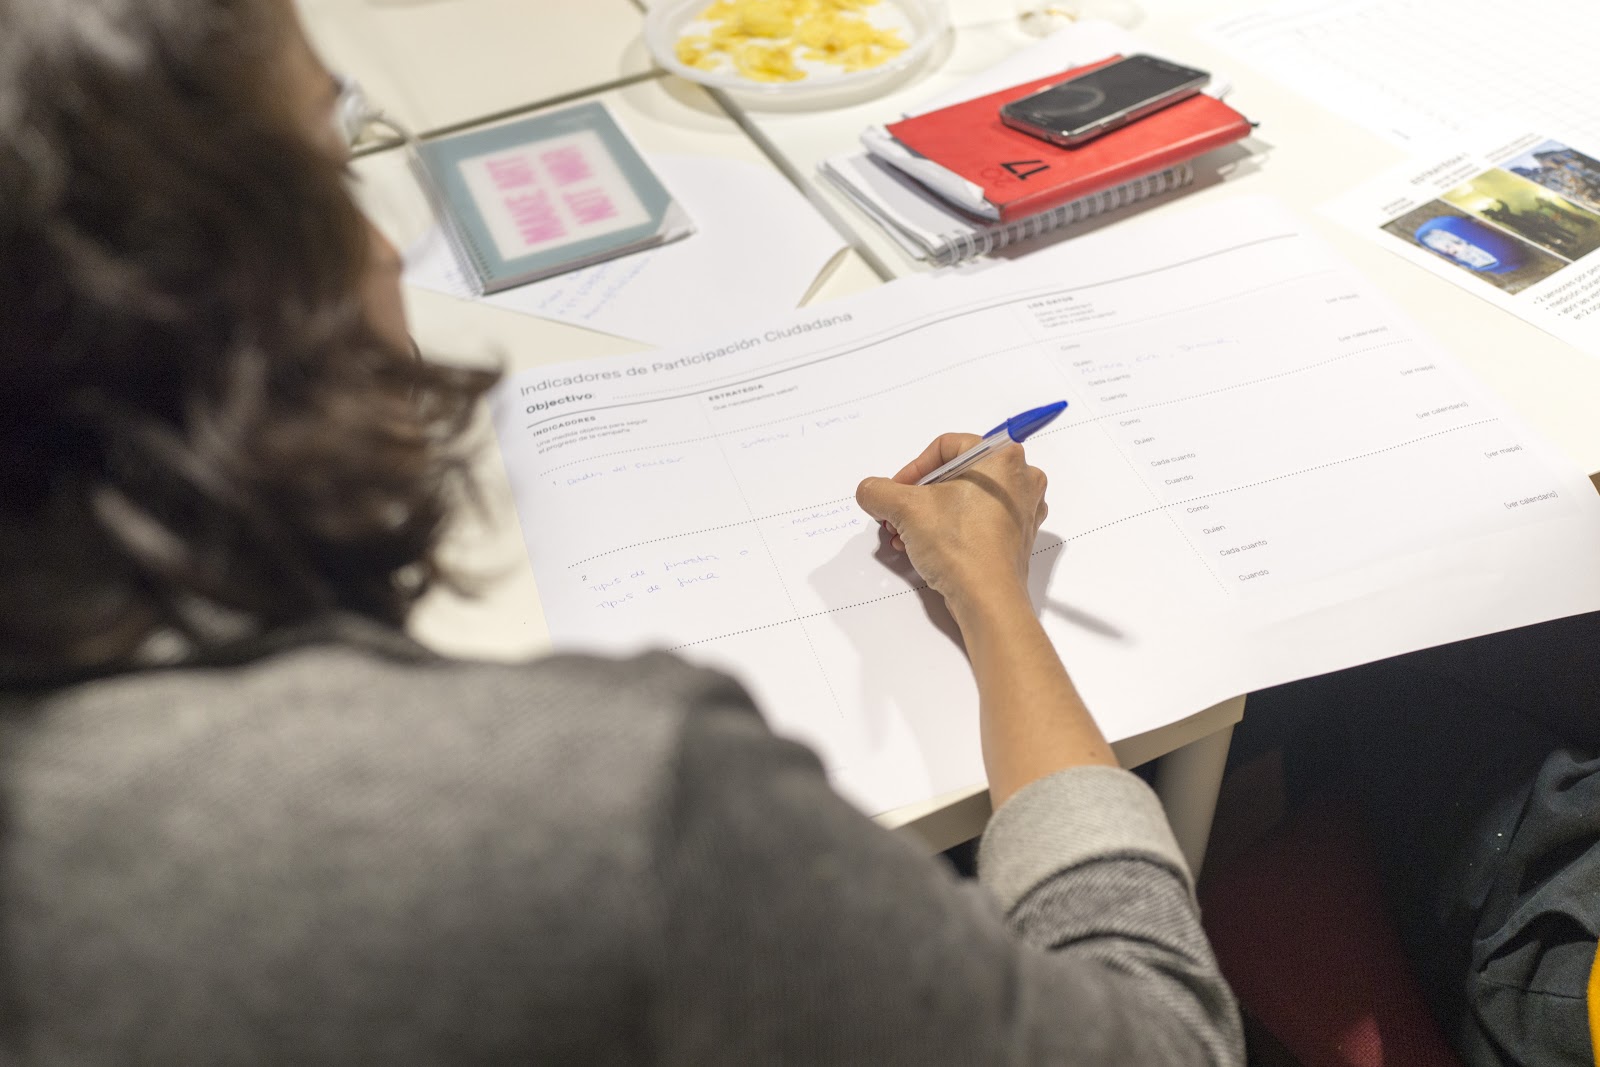
It is difficult for people to understand how data are relevant to their lives, or how they are connected to the challenges they face. This is even more important when benchmarks are set by others (e.g. government officials or researchers) in a non-transparent way that do not relate to the community’s concerns. CLIs are a good way to connect the dots between sensor data and real life. They also help participants to monitor the impact of their actions by tracking and measuring real change. The Community Level Indicators tool helps participants to collaboratively choose what information will be collected, and how. You can also use this tool at the end of a data collection period, to see how actions have made a difference.
What change do we want to see happen, and how can we measure that change?
60-90 minutes
Facilitators, participants, external experts, government officials
2-20 people (max recommended if the facilitator is running the session for the first time). Participants will be divided into groups of 4-5 people.
A1 Community Level Indicators Canvas (see link at the bottom of this step), markers, pens, sticky notes and sticker dots.
Find a space with a few tables and chairs where people can sit comfortably for at least an hour. Having enough room to be able to give each table a bit of space is important. Try to limit each table to seat five people max.
Print the Community Level Indicators canvas, you can find it in the downloads section at the end of this article. Supply markers, pens, and sticky notes to each table but keep the Community Level Indicator canvas off to the side for the start of the activity.
Steps:
Gather everyone together to decide on the aims or goals of your project. You can do this by using a quick ideation exercise: Ask everyone to jot down a change they hope will happen as a result of the campaign using the sticky notes and pens.
Once everyone has one or two ideas noted down, cluster similar ideas together. After this quick edit, ask everyone to vote with sticker dots on their preferred goal, the two with the highest number of votes are then used as the initial goals of the campaign.
Then, divide everyone into groups of 4-5 people, give each group a Community Level Indicator canvas for their table. Each group chooses a goal and uses the canvas to decide on the indicators that can be measured to track the progress of that goal. Each group also decides on the strategy and logistics for collecting these data. Ask the groups to consider: ‘what’, ‘who’, ‘when’ and ‘how often’ can these indicators be measured.
The groups repeat this process for up to three different indicators. When the activity is finished, each group presents their results back to everyone. Then, using sticker dots, everyone votes openly on the indicators they would most like to monitor. The indicators with the highest number of votes are then taken forward and tracked.
Participants keep a record of their indicators using data journals, or other devices, such as smartphones, to note information or take photographs. The indicators should be shared and analysed alongside the sensor data.
The Community Level Indicators tool was first created by the Making Sense project, the original tool can be found in (Citizen Sensing: A Toolkit)[https://doi.org/10.20933/100001112]. It is shared under the Creative Commons license CC BY-SA.
For some additional reading on this topic please see Coulson, S, Woods, M, Scott, M, Hemment, D & Balestrini, M 2018, Stop the Noise! Enhancing Meaningfulness in Participatory Sensing with Community Level Indicators. in Proceedings of the 2018 Designing Interactive Systems Conference. Association for Computing Machinery (ACM), pp. 1183-1192, Design interactive Systems 2018, Hong Kong, China, 9/06/18.
Image 1: Unsplash (CCO)
Image 2: Making Sense project (CC-By SA)
Image 3: Making Sense project (CC-By SA)
Image 4: Making Sense project (CC-By SA)
Image 5: Making Sense project (CC-By SA)